

The S&P 500 fell 0.6% last week to finish October down 0.9%. Despite last week’s decline, breadth was strong. Underneath the hood, the average stock gained 0.8%, and 349 names in the index had a positive return.
Yes, the index was down for October, the fourth down month in the last five, but losses were modest and the other month (August) was so strong the index is actually up over the whole period. The good news—just like last week, strong market breadth in October helped limit the impact of declines in technology names. In fact, the S&P 500 equal weight index actually saw a 4.9% gain in October, and the median stock soared 7%. Throw in that the Bloomberg Aggregate Bond Index, a widely used bond benchmark, had its best month since December 2023, and a diversified allocation may have actually had an okay month.
Still, the market mood has been sour, but we usually take that to be a good thing. Here are some things we’ve been watching.
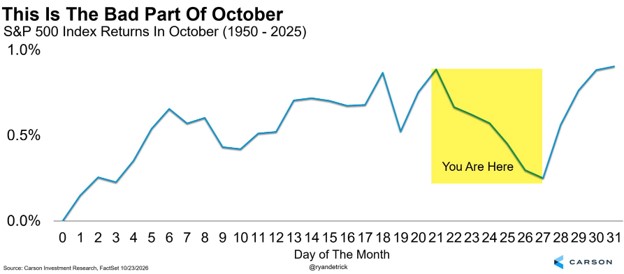
Late October is historically where lows tend to form
The end of October can be rough, and it was this year, but stocks tend to form a major low in late October. The timing won’t be perfect, and we never make investment decisions just based on the calendar. We just say be open to the possibility that we could see a seasonal tailwind. More important, with many signs of extreme fear out there, the likelihood of being near another major low start to look attractive.
Sentiment check
It really has been a fascinating market, as the S&P 500 has simply chopped around in a sideways fashion for many months now, yet worry and concerns in some cases are quite extreme.
According to Goldman Sachs, hedge funds had one of their worst days ever on Thursday, October 22, as the names most hedge funds are long versus the most-shorted names fell 4.2%, the worst day since the US debt downgrade in August 2011. The same measure was down more than 10% month to date as of Friday, October 23.
Adding to the pain that hedge funds are seeing, Bloomberg noted that the level of hedge fund shorts (bets against the market) was near a five-year high. History is full of plenty of examples when the crowd is hedged like this. When that happens, the most painful market is one that moves higher, and this could happen again.
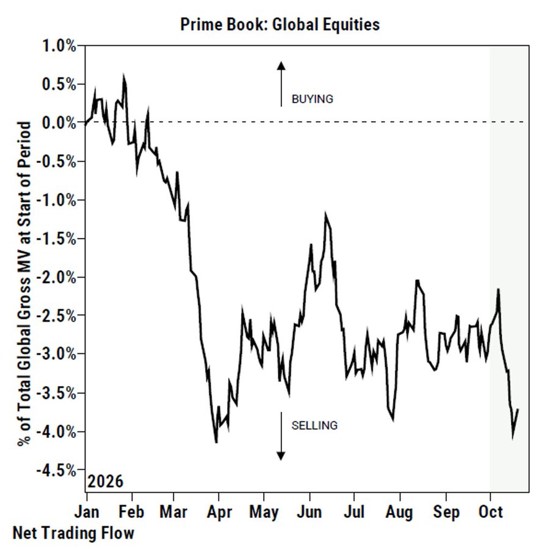
Another angle on this is the Goldman Sachs Prime Book showed selling of global equities recently was the most extreme since late March of this year, a period that was followed by a historic rally in April and May. We’re not saying this will happen again, but if the market does start to move, unwinding these positions could add fuel to a rally.
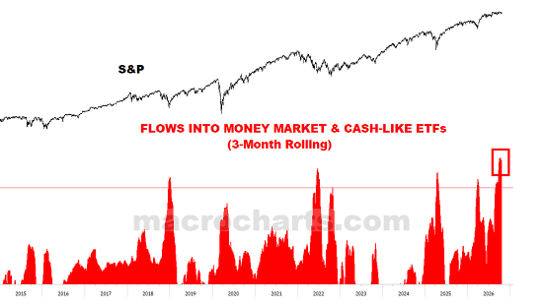
Lastly, @MacroCharts shared this chart recently, and it shows a huge move into money markets and cash-like ETFs. Yes, some of this could be because you can finally get something on cash and many are moving away from bonds, but you can see on the chart that previous surges have marked nice times to expect a rally in stocks and get long.
Seasonality favors a year-end rally
We continue to expect a nice move higher into the end of the year. With the seasonally bullish months of November and December ahead and signs of extreme pessimism, the stage could be set nicely for a rally. Of course, we would need something to spark it.
The Fed fiddles while things run hot
Federal Reserve Chairman Kevin Warsh didn’t want to give forward guidance prior to the Fed’s most recent meeting, which concluded on Wednesday, October 28. But guidance from his fellow members more or less trapped the Fed into holding rates unchanged. That’s despite the Fed’s own description of 1) a “strong” economy (upgraded from “solid”), 2) job gains keeping pace with the workforce and steady unemployment, and 3) elevated inflation. Normally, those would be conditions to raise rates. The Fed says it wants more information to ensure a “timely return” to its 2% inflation target. The only surprise is that this was called a hawkish hold. In John McEnroe’s words, “you cannot be serious!” It doesn’t seem to us like there was anything hawkish about it.
Since the Fed wants more information, let’s look at the data. We got plenty of it last week.
Private demand is booming
The economy grew 3.4% annualized in Q3, after adjusting for inflation. Headline GDP can be distorted by net exports and inventories, so it’s useful to look at final sales to private domestic purchasers, which removes those categories as well as government spending. What’s left is spending by households and businesses. That surged 4.9% annualized in Q3 and is up 3.3% from a year ago. For perspective, it grew 3.3% annually in 2023-2024 and 3.0% in 2010-2019.
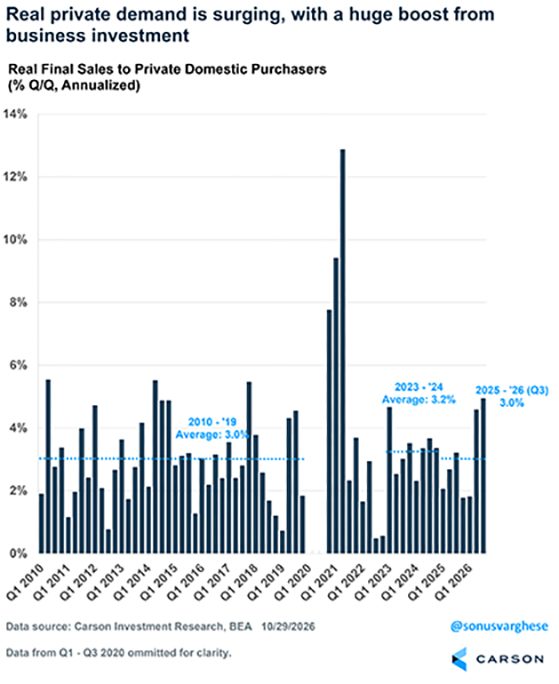
Not all that spending translates into domestic production, since imports satisfy some of the demand. Imports subtract from GDP because they are produced abroad, even though they show up in domestic spending. But the message is clear: private domestic demand is booming, and that matters for how we should think about monetary policy.
The AI buildout is doing the heavy lifting
Of course, if you’ve been following us for a while, one major driver shouldn’t be surprising: the AI buildout. Business investment contributed 1.7 percentage points (pp) to Q3 GDP growth, roughly half the total. AI-related spending was key:
- IT equipment investment surged 37% annualized in Q3 and averaged 29% over the past seven quarters, versus just 6% annually in 2010-2024.
- Software investment rose 10% annualized in Q3 and averaged 15% over the past seven quarters, versus 9% in 2010-2024.
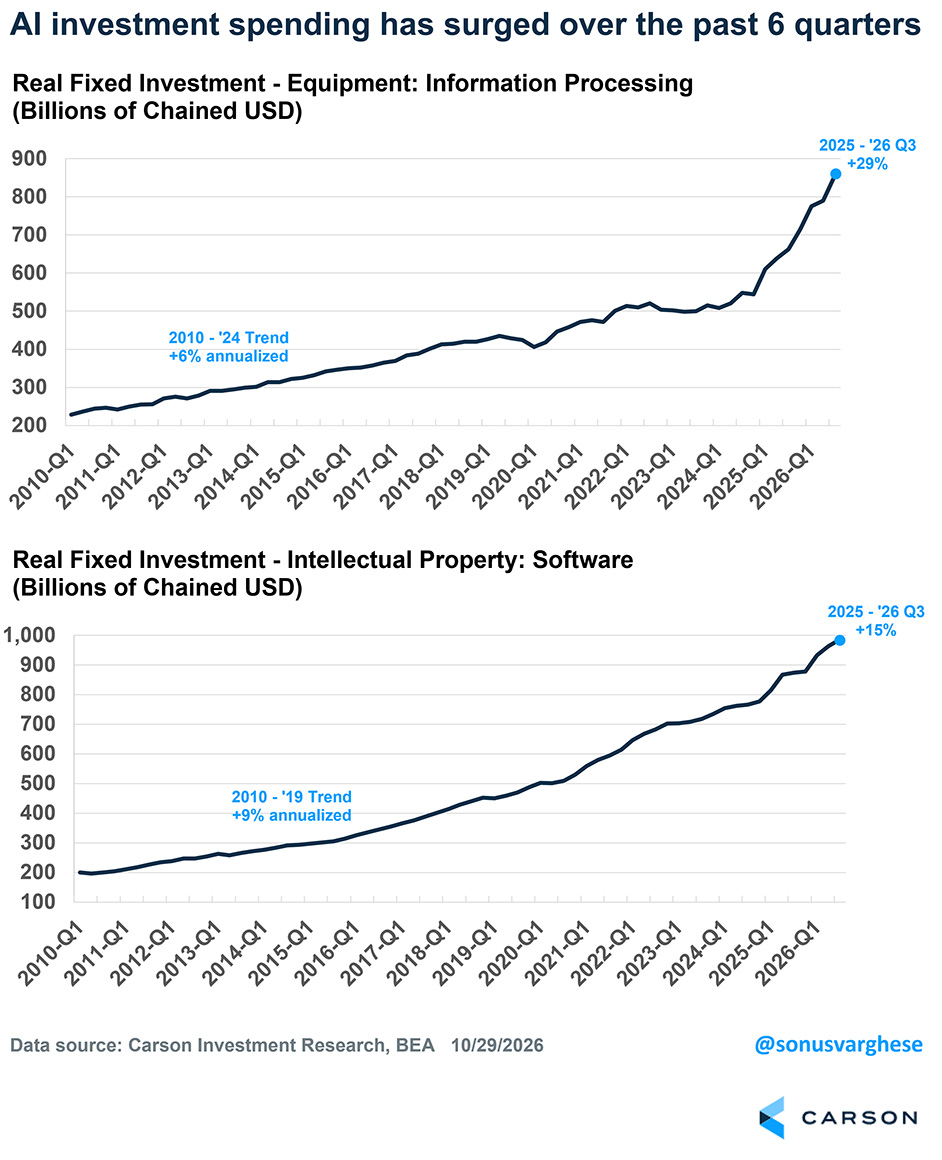
These numbers are simply massive, and their contribution to economic growth has been extraordinary. Real GDP averaged 2.3% annualized over the past seven quarters, with IT equipment and software investment contributing 0.91 pp per quarter, almost 40% of total growth. Consumption contributed 1.59 pp, but it accounts for 68% of GDP, whereas these investment categories are only a small fraction of the economy.
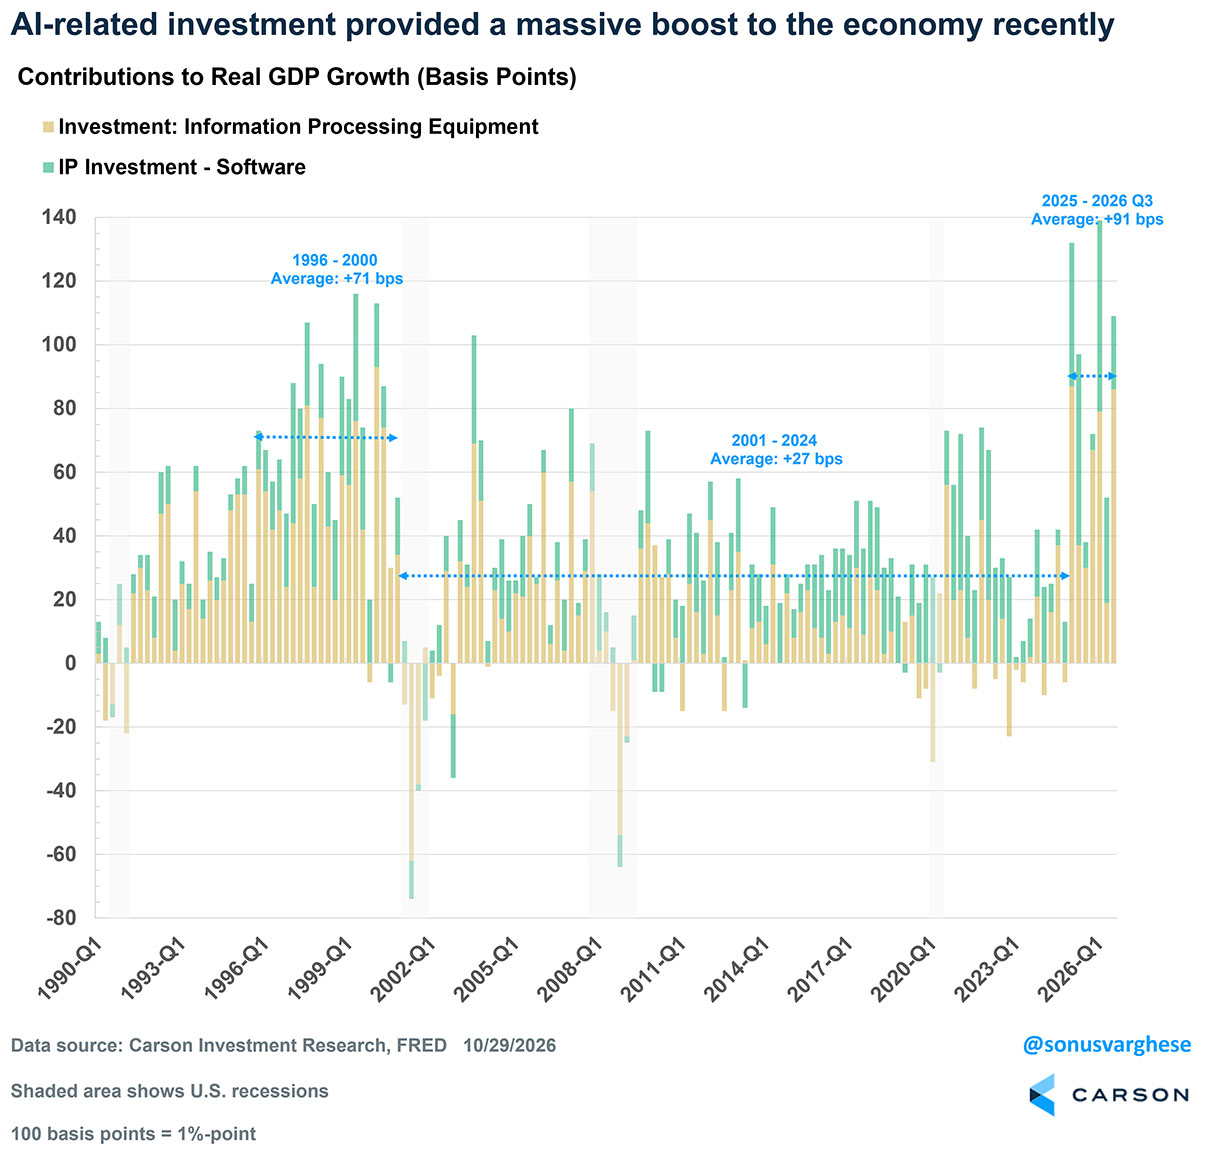
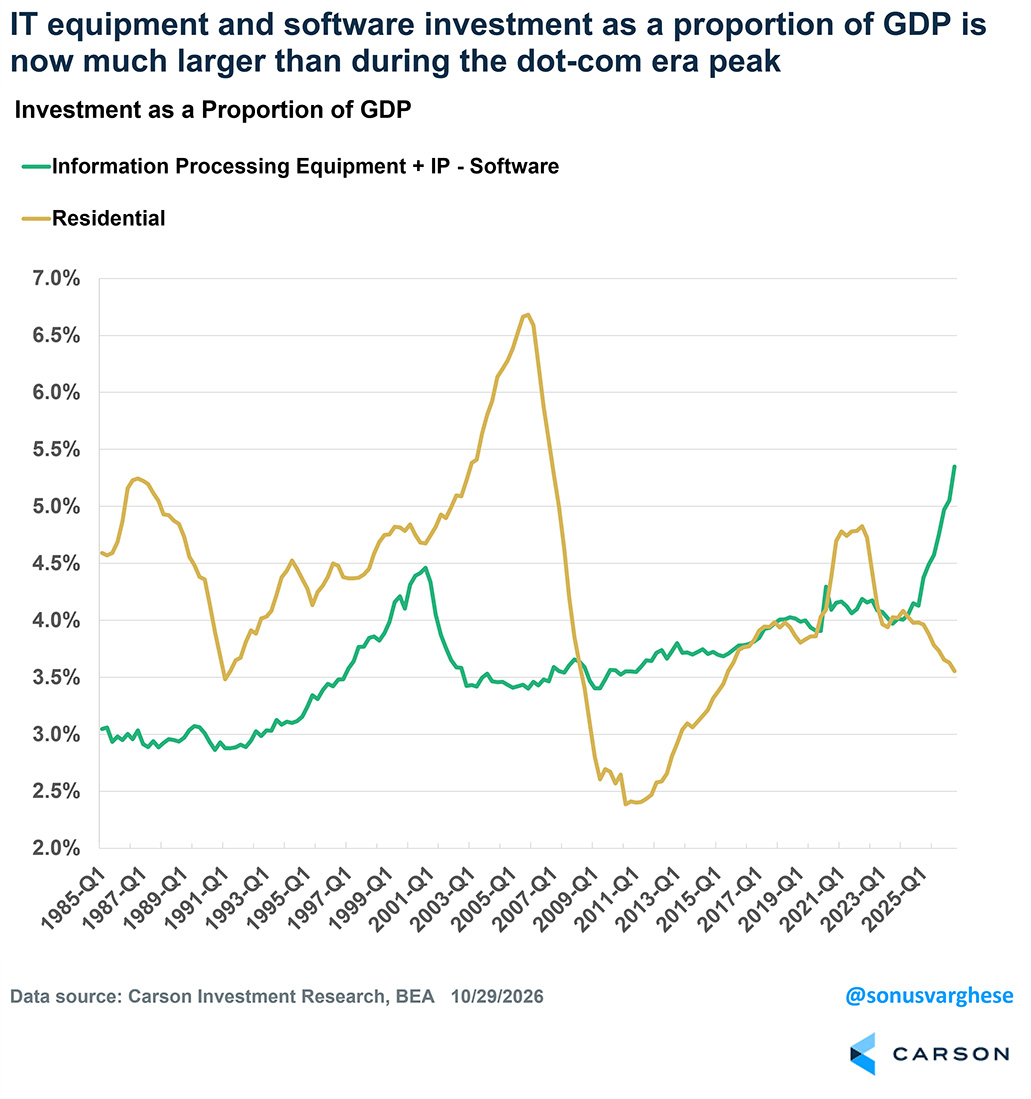
For perspective, IT equipment and software contributed just 0.27 pp per quarter from 2001-2024, and 0.71 pp during the internet boom of 1996-2000. Together, those categories now account for nearly 5.5% of GDP, above the dot-com-era peak of 4.5%. The share would exceed 7% if we include datacenter construction and AI-related industrial equipment. For perspective, residential investment made up over 6.5% of GDP at the peak of the housing bubble (it’s collapsed to about 3.5% since then). That tells you the scale of what’s happening. The AI investment surge is doing much more of the heavy lifting for growth than its relatively small share of the economy would suggest. This is hardly a minor part of the expansion anymore.
Nominal growth shows how dovish the Fed really is
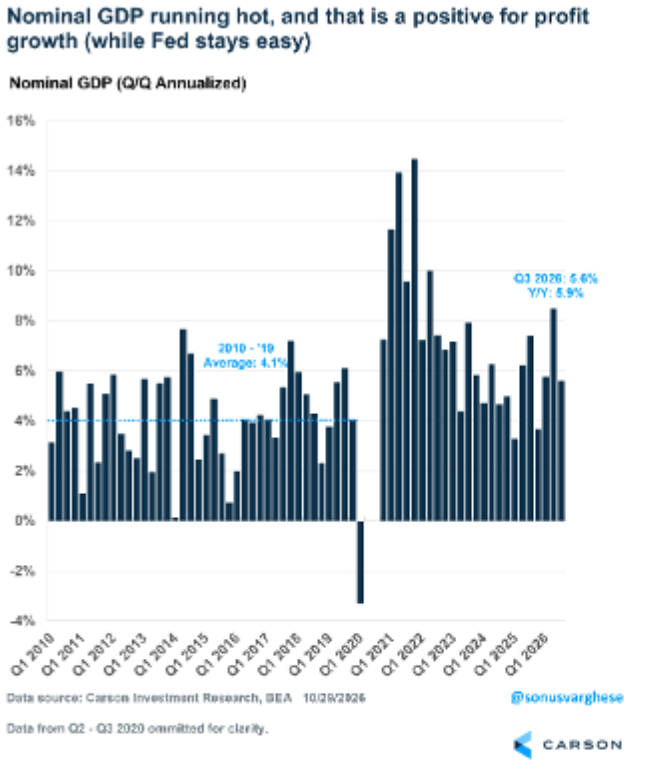
The numbers above are adjusted for inflation. Add that back, and the economy is running even hotter. Nominal GDP grew 5.6% annualized in Q3 and is up 5.9% year over year, well above the 4.1% annual pace in 2010-2019. Which brings us back to the Fed.
The Fed has raised rates by 0.25 pp this year, barely starting to reverse the 1.75 pp of cuts in 2024-2025. In Q2 2024, before those cuts, nominal GDP was growing 6.2% year over year, unemployment was 4.1%, and the upper end of the Fed’s policy range was 5.5%. Today, nominal growth is close to that pace and the unemployment rate is 4.14%, but the policy rate is just 4.0%. That captures how dovish policy actually is, regardless of the rhetoric. The Fed is willing to let things run hot, and that is a meaningful change from where policy stood just over two years ago, despite broadly similar nominal growth and labor market conditions. If anything, the latest data makes it harder to argue that the economy urgently needs additional monetary support.
One thing to keep in mind is that strong nominal growth supports corporate revenues and profits, which is a near-term positive for stocks. At least until the Fed feels compelled to rein things in. And that brings us to inflation.
Inflation is ugly, and the Fed keeps moving the goalposts
The inflation numbers are ugly, and the only consolation is that they’re not as bad as in 2022. At the end of 2023, the median Fed official expected core PCE inflation to reach 2% in 2026. By the end of 2024, that had slipped to 2027; in 2025, to 2028; and now to 2029. “Timely return” clearly doesn’t mean what you and I think it means. The Fed has repeatedly pushed back the expected date of victory over inflation, without a corresponding sense of urgency in its policy decisions.
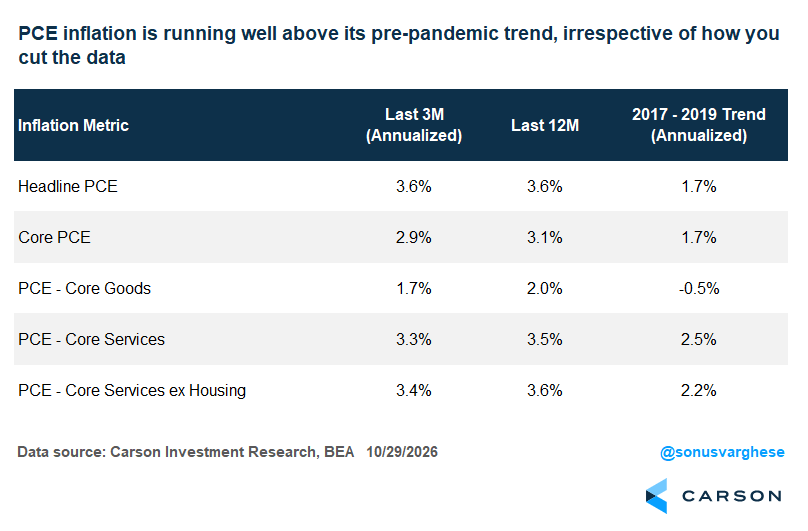
The latest Personal Consumption Expenditures Price Index (PCE) report showed headline inflation running at 6.1% annualized in September and 3.6% over three months. Energy is a big driver, but inflation remains problematic even without it. Core PCE rose 3.9% annualized in September and 2.9% over three months. Both goods and services are contributing:
- Core goods prices increased 1.7% annualized over three months, amid tariffs and AI-related bottlenecks. That may sound modest, but goods prices generally fell from 1995 through 2021.
- Core services excluding housing rose 3.4% annualized over three months. You can’t simply blame energy, tariffs, or AI for that.
The table below puts these numbers in context. Every measure is running above its 2017-2019 trend. And this is no temporary spike: year-over-year core PCE inflation has exceeded 2.5% for 66 consecutive months and currently stands at 3.1%. In other words, the inflation problem predates the latest energy shock and cannot be dismissed as just another one-off supply disruption. Price pressure remains broad, across goods and services.
Over the past five years, headline PCE inflation has averaged 3.8% annually, versus 3.6% for core. Remember, the Fed targets headline inflation; core is simply a guide to where it may be heading. The difference between 2% and 3.8% inflation compounds quickly. A basket costing $100 five years ago would now cost $110.41 at 2% inflation, versus $120.50 at 3.8%.
The risk of fiddling while the economy runs hot
The Fed is waiting for more information, but it’s hard to understand what additional evidence they need. Staying on hold suggests officials are comfortable letting the economy run hot, even as inflation remains entrenched. Warsh has also announced fewer meetings at which the Fed will consider rate changes: seven in 2027 (down from eight) and six in 2028. That adds to the risk of falling further behind. And the longer the Fed waits, the greater the chance it ultimately has to inflict more economic (and market) pain to bring inflation down. What looks supportive for markets today can therefore create the conditions for a much tougher policy response later. That’s the risk of fiddling while the economy runs hot.
S&P 500 — A capitalization-weighted index of 500 stocks designed to measure performance of the broad domestic economy through changes in the aggregate market value of 500 stocks representing all major industries.
The NASDAQ 100 Index is a stock index of the 100 largest companies by market capitalization traded on NASDAQ Stock Market. The NASDAQ 100 Index includes publicly traded companies from most sectors in the global economy, the major exception being financial services.
The views stated in this letter are not necessarily the opinion of Cetera Wealth Services LLC and should not be construed directly or indirectly as an offer to buy or sell any securities mentioned herein. Investors cannot invest directly in indexes. The performance of any index is not indicative of the performance of any investment and does not take into account the effects of inflation and the fees and expenses associated with investing.
A diversified portfolio does not assure a profit or protect against loss in a declining market.
All investing involves risk, including the possible loss of principal. There is no assurance that any investment strategy will be successful. This information is from sources believed to be reliable, but Cetera Wealth Services, LLC cannot guarantee or represent that it is accurate or complete.
9213867.1-1126-C
